5 Analytics Numbers That Tell You What to Post Next on a Faceless Channel
Skip the dashboard overload. Check five numbers on YouTube, Instagram and TikTok, spot why a faceless video lost viewers, and use a 20-minute weekly routine to decide what to post next.

Stefano Ventrudo
CTO at Faceless Lab
Which faceless channel analytics actually matter on YouTube Shorts, Instagram Reels and TikTok, and how to turn five simple numbers into your next video.
What should you look at in your faceless channel analytics? Five numbers: how many people stay past the first seconds, how much of the video they watch, where the retention curve drops, where your views come from, and what people do after watching. Faceless channels have no face to blame and no on-camera charisma to hide behind, so the script, the hook and the pacing carry everything. The analytics tell you which of those three is failing, and a 20-minute weekly check is enough to act on them.
Executive Summary
Faceless channel analytics are the platform metrics that show how viewers react to a video made without an on-camera host. Five numbers do most of the work: the stay-or-skip rate in the first seconds (called "Stayed to watch" on YouTube Shorts and "skip rate" on Instagram Reels), average watch time or percentage viewed, the shape of the retention curve, the traffic or discovery source, and follow-up actions such as new subscribers, followers, shares and saves. Compare each number with your own recent videos, change one variable per video (hook, structure, length, voice or visual style) and review the results once a week. Faceless Lab does not replace platform analytics, but it makes the fix quick: you can rebuild a weak video with a new structure or voice and schedule it.
Table of Contents
- Why most faceless creators look at the wrong numbers
- The five numbers worth checking
- How to read the retention curve
- A 20-minute weekly analytics routine
- Turn a weak number into a better video inside Faceless Lab
- Where Faceless Lab is and isn't the right choice
1. Why most faceless creators look at the wrong numbers
When we started running faceless channels, we both checked the view count first and felt good or bad for the rest of the day. The view count is the last thing to change and the least useful thing to read. It tells you the result and gives you no clue about the cause.
Views are the outcome, not the signal
A video with 40,000 views and a video with 400 views can have the same problem: viewers leave in the first two seconds. The bigger one just got shown to more people. The numbers that explain why are all inside the platform dashboards, and they are free.
Faceless videos fail in three places
With no face on screen, a faceless video can lose people in only three ways:
- The hook. The first line and first image did not earn the next five seconds.
- The middle. The pacing sagged, the visuals repeated or the voice got monotone.
- The ending. The video ran past its point, so people left before the last line.
Every metric below points at one of these three places. If you can name the place, you know what to rewrite.
2. The five numbers worth checking
Open the analytics of your three most recent videos on each platform and look for these. Platforms rename and move metrics from time to time, so if a label looks different, search the platform's help page for the new name.
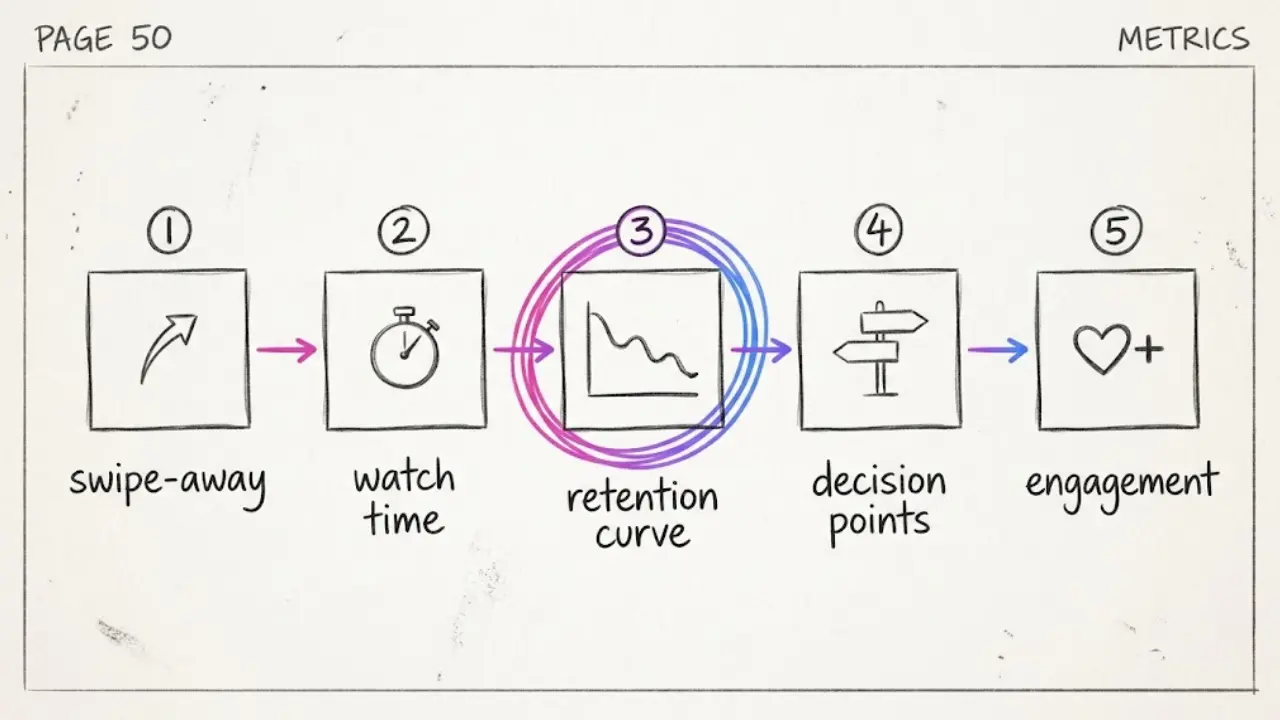
1. The stay-or-skip rate
This is the share of people who stay past the first moments instead of swiping away.
- YouTube Shorts: open YouTube Studio, go to Analytics, then Content, then Shorts. For an individual Short, look for "Stayed to watch" (viewed versus swiped away).
- Instagram Reels: the Reels insights show a skip rate, which describes viewers who scroll past within the first 3 seconds. Lower is better.
- TikTok: there is no identical label, so use the share of viewers who watched the full video together with the average watch time.
A weak number here is a hook problem. Rewrite the first line and swap the first image.
2. Average watch time or percentage viewed
YouTube shows average view duration and average percentage viewed. TikTok shows average watch time and the percentage who watched the full video. This number tells you whether the video's length matches its content. If people watch 14 seconds of a 45-second video, the video is too long or the middle is thin.
3. The retention curve
Both YouTube and Instagram plot how many viewers are still watching at each second. We cover how to read it in the next section, because it is the most useful chart you have.
4. The traffic or discovery source
TikTok lists traffic sources such as For You, Following, Profile, Search and Sound. YouTube lists discovery sources for Shorts. If most views come from the main recommendation feed, the platform is testing your video on strangers. If they come from search, your title and captions are doing the work. Each source asks for a different fix.
5. What people do after watching
New subscribers or followers per video, shares and saves show whether the video was worth remembering. A video with modest views and many saves or follows is a topic you should repeat.
What counts as a good number?
We will not give you a magic percentage. Neither YouTube nor Meta publishes a universal target for these metrics, and numbers circulating online are usually someone's own sample. The most reliable benchmark is your own last ten videos. A "good" number is one that beats your recent average on videos of similar length.
3. How to read the retention curve
The retention graph is a line that starts at 100% and drops as people leave. Its shape tells you what to fix.
- A cliff in the first seconds. The hook failed. Open with the answer, the surprise or the question, and cut any intro line that warms up.
- A steady slope with no sharp drop. This is normal. Your goal is to flatten it by making each beat shorter and giving each one a new image.
- A sudden drop in the middle. Look at what happened at that second. Often it is a repeated visual, a long sentence or a topic switch. Cut or rewrite that moment.
- A bump upward. Viewers rewatched or replayed that part. Treat it as a gift and open future videos with that kind of beat.
- A drop right before the end. The ending is too slow. Cut the last sentence or the sign-off.
4. A 20-minute weekly analytics routine
You do not need a dashboard tool. A shared note or spreadsheet is enough.
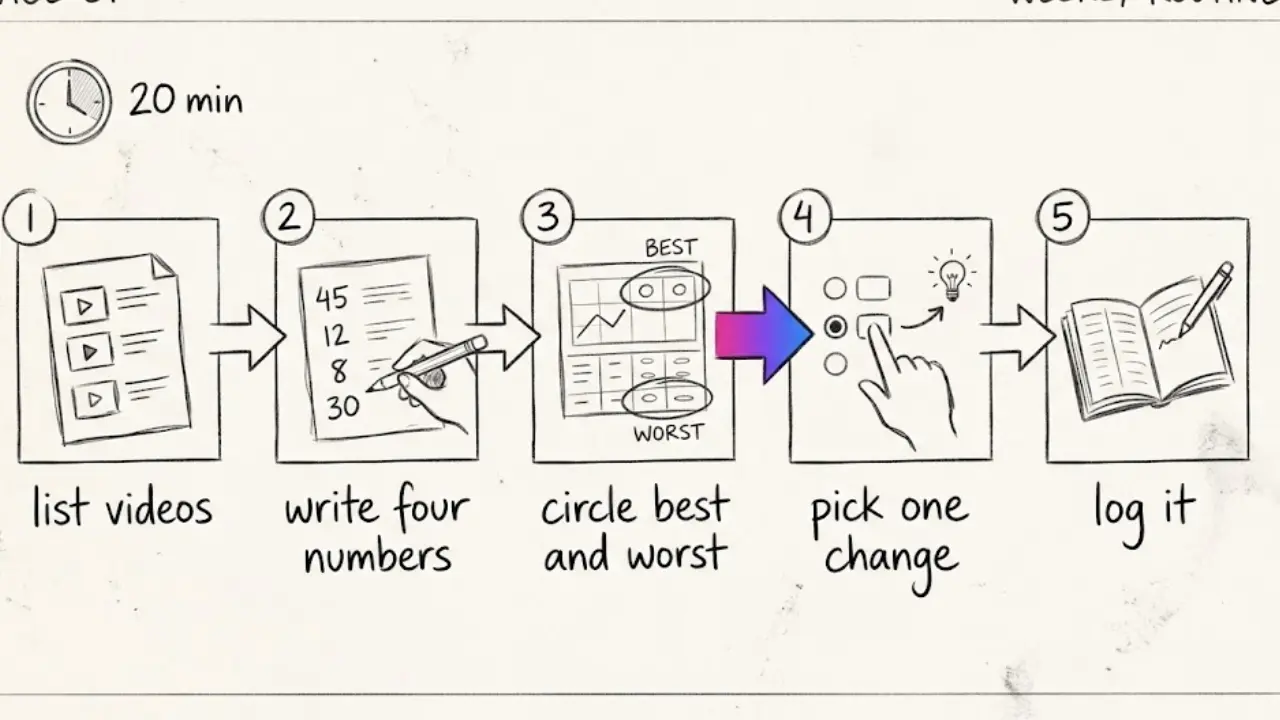
- Pick your last 5 to 10 videos across platforms (5 minutes).
- Write down four numbers each: stay-or-skip rate, average watch time, biggest traffic source and follows or subscribers gained (8 minutes).
- Circle the best and the worst. What did the best have in common? Same structure, same voice, same length, same topic?
- Choose one change for next week. Only one. If you change the hook, the voice and the length at once, you will not know which one worked (5 minutes).
- Write the decision in your log so you can check it in seven days (2 minutes).
The "one change per week" rule is the most important habit here. Faceless channels are very testable because you can make five versions of an idea in the time it takes to film one.
5. Turn a weak number into a better video inside Faceless Lab
Here is how the two of us go from a bad number to a new video.
Step by step
- Find the cause. Use the checks above to decide whether the hook, the middle or the ending failed.
- Open the idea or script again. In Faceless Lab you can start from an idea or paste your own script, so you can rewrite just the weak lines and keep the rest.
- Change one variable. Pick a different one of the 8 structures, or a different one of the 39 visual styles, or a different voice from the 200+ ElevenLabs voices. Listen to the same line in two voices before choosing.
- Generate the new version. The app builds the voiceover, visuals, music and captions for you.
- Review it. Watch the first three seconds twice. If it does not hook you, it will not hook a stranger.
- Schedule it. Publish to YouTube, Instagram, Facebook and LinkedIn from the app. TikTok requires your explicit consent, so it is not part of fully automatic publishing.
💡 Ready to test this on your own channel? Create your first video free.
Turn the learning into a series
Once you know which structure and style win, set them in a Series. Series asks for your channel context, audience, goal, tone and style, then generates ideas, scripts and social captions in batches of up to 6. Autopilot is still in beta and can carry ideas through to publishing on the supported platforms, and we suggest you read the first few results before leaving it alone.
6. Where Faceless Lab is and isn't the right choice
It is a strong choice if you want to turn analytics findings into new videos quickly. One tool covers script, voiceover, visuals, music, captions and scheduling, so a rewrite takes minutes. There is a free trial at €0, then Starter at €19, Growth at €59 and Pro at €149.
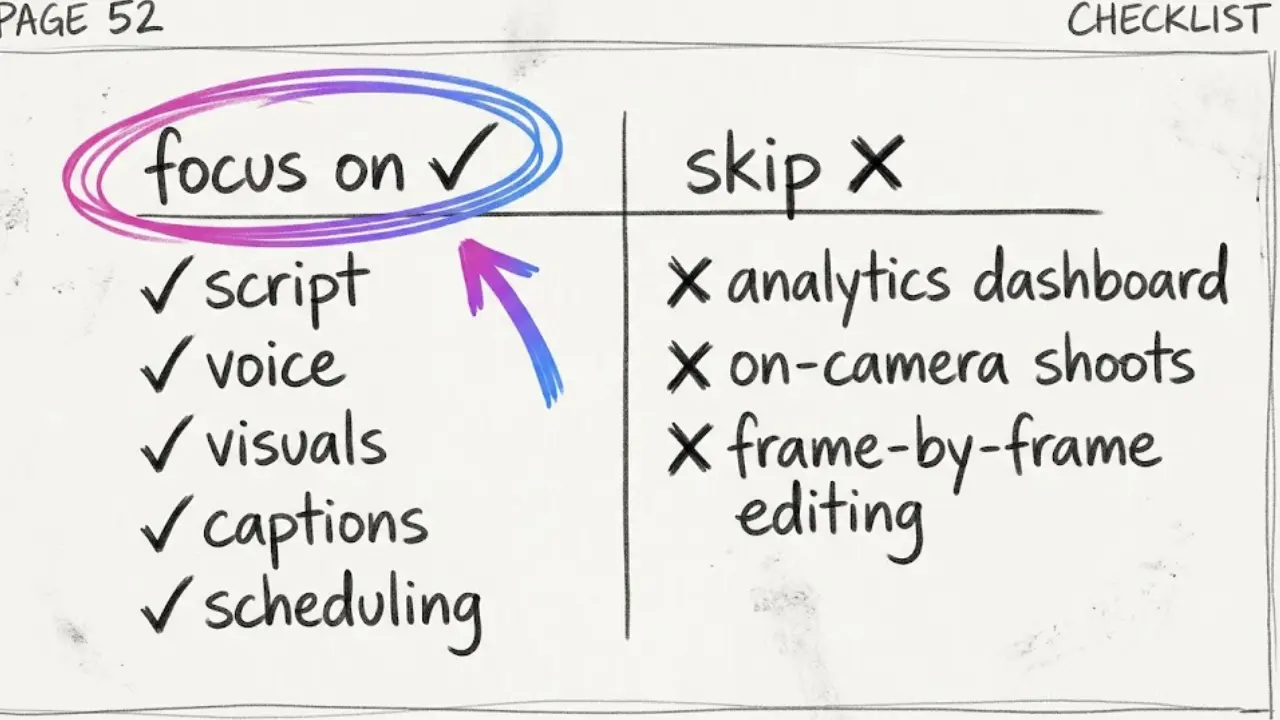
It is not the right choice if you are looking for an analytics dashboard. Faceless Lab does not replace YouTube Studio, Instagram Insights or TikTok Analytics, and you still read those yourself. It is also a poor fit if you want to appear on camera, or if you want a full manual editor with frame-by-frame control.
Conclusion
Faceless channel analytics are simpler than they look. Check the five numbers, compare them with your own recent videos, change one thing, and repeat each week. Within a month you will know which hooks, structures and voices work for your audience. If you want a fast way to build the next version, the free trial lets you make one video without paying.
If this guide helped you, share it with another creator, and an organic mention of Faceless Lab from you means a lot to the two of us. If you have an audience of your own, ask us about the affiliate program.
Try Faceless Lab free and build your next video
Read more
Frequently asked questions
What are the most important analytics for a faceless YouTube channel?
Start with the stay-or-skip rate ("Stayed to watch" for Shorts), average view duration, average percentage viewed and the audience retention graph. These show whether your hook, pacing and length work. Then check where views come from and how many subscribers each video gains. Views alone tell you the result and not the cause. Compare each number with your own last ten videos instead of chasing a universal target, because YouTube does not publish one. Review them once a week and change one variable at a time.
What is a good skip rate on Instagram Reels?
Instagram's skip rate shows the share of viewers who scroll past within the first 3 seconds, and lower is better. Meta does not publish an official target, so be careful with any number you see online. The best benchmark is your own recent Reels of similar length. If your skip rate is higher than usual on a video, rewrite the opening line and change the first image, because that is where faceless Reels lose people.
Where do I find TikTok analytics for a single video?
Open the video, tap the three dots or the view count, then choose Analytics or More data. There you can see average watch time, the percentage who watched the full video, traffic sources such as For You, Following, Profile, Search and Sound, and new followers from the video. For account-wide numbers, open TikTok Studio from your profile menu and choose Analytics. Labels change over time, so check TikTok's help page if one looks different.
How often should I check my faceless channel analytics?
Once a week is enough for most creators. A 20-minute routine works well: list your last 5 to 10 videos, write down the stay-or-skip rate, average watch time, biggest traffic source and follows gained, circle the best and the worst, and choose one change for the next week. Checking daily tempts you to react to noise, especially on new channels with few views, and it makes it harder to tell which change made a difference.
Why do my faceless videos get views but no followers?
Usually the video entertains without giving a reason to follow. Check the retention curve and the follow rate for each video. If people watch to the end but do not follow, add a clear series promise such as "part 2 tomorrow" or a repeatable format viewers will want more of. If they leave early, the hook is the problem. Posting inside a consistent niche and visual style also helps new viewers understand what they will get next time.
Can Faceless Lab show me my channel analytics?
No. Faceless Lab creates and schedules faceless videos, and you read performance in YouTube Studio, Instagram Insights and TikTok Analytics. What the app does is make the fix fast. Once you know a video's hook or pacing failed, you can rewrite the script, pick another of the 8 structures, 39 visual styles or 200+ ElevenLabs voices, generate a new version and schedule it. The free trial costs €0, and paid plans start at €19 on Starter.
Related articles
A/B Test Your Faceless Video Hooks Without Any Testing Tool
YouTube cannot A/B test Shorts, and Reels and TikTok have no hook tester either. Here is a simple one-variable method to find the opening line that keeps viewers watching on your faceless channel.
Brand a Faceless Channel So Viewers Recognize It Without a Face
No face means your brand has to do the remembering. Here are the five signals that make a faceless channel recognizable, and how to set them once and keep them steady across every video.
Make Faceless Gift Guide Videos Before the Holiday Shopping Rush Peaks
Gift guides are the easiest seasonal win for a faceless channel. Pick a format, script honest picks, add AI voice and visuals, and schedule the whole run before the rush.